Maps

Map 01. Regional innovation performance

Map 02. Regional Knowledge Economy (KE)

Map 03. Out-migration from the regions with high shares of highly educated people

Map 04. Dominant employment type and regional economic performance

Map 05. Regional typology of eGovernment interactions

Map 06. Drinking water supply and demand in the Alpine mountain range
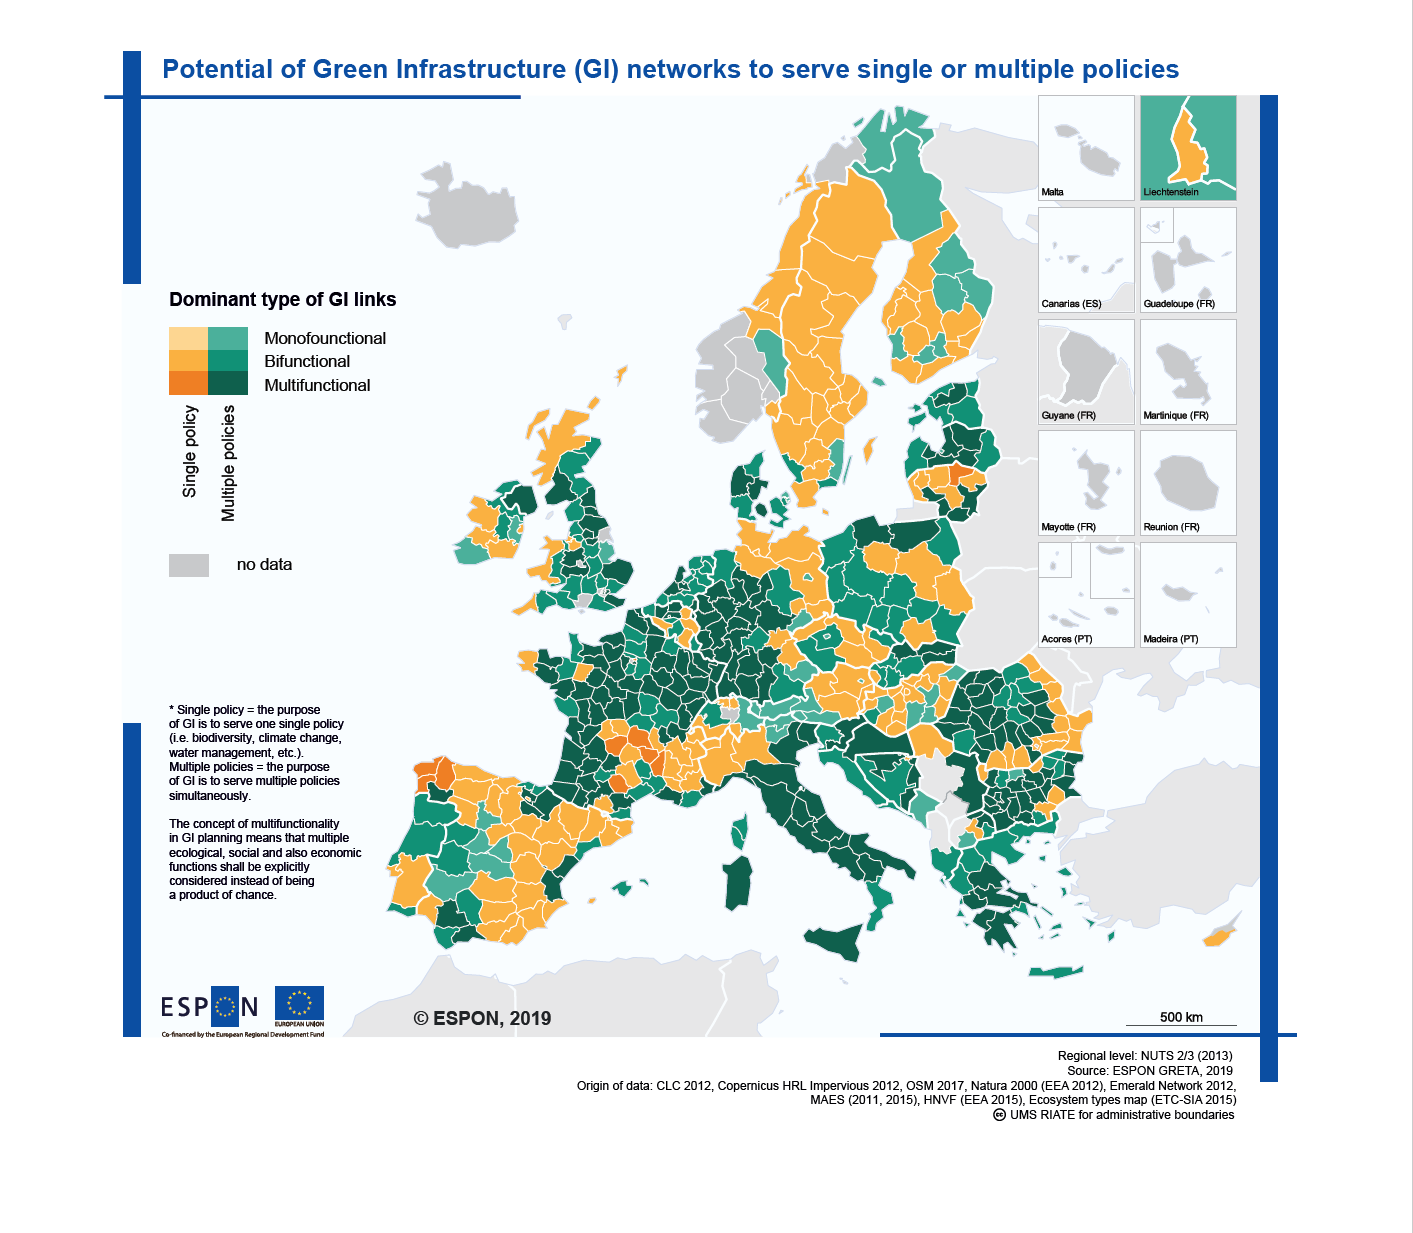
Map 07. Potential of Green Infrastructure (GI) networks to serve single or multiple policies

Map 08. Coverage of potential Green Infrastructure (GI) and changes of urban green areas

Map 09. Climate change impacts in the main biogeographical regions of Europe

Map 10. Aggregated potential impact of climate change

Map 11. Installed capacity and the potential of wind power

Map 12. Territorial impacts of the transition to 100% renewable energy

Map 13. Domestic Material Consumption (DMC)

Map 14. Turnover growth of material providers

Map 15. Accessibility potential by rail

Map 16. Hinterland accessibility of main ports

Map 17. Coverage of Trans-European Transport Networks (TEN-T) in mountain areas

Map 18. Inner peripheries according to poor access to Services of General Interest (SGI)

Map 19. Travel time to the nearest regional centre in Baltic states

Map 20. Broadband access and high-speed internet coverage

Map 21. People not in Education, Employment or Training (NEET)

Map 22. Assessment of future Cross-Border Service (CPS) development needs

Map 23. Asylum applications

Map 24. Attractiveness of the regions in the context of migration

Map 25. Population change in Functional Urban Areas (FUA)

Map 26. Population dynamics in Inner Peripheries (IP)


